How to Test Assumptions with the Experiment Cards
Turn your product ideas into product experiments by testing your riskiest assumptions (includes free experiment template for Miro, Mural, and Figjam)
Reading Time: 20 minutes
Designing experiments is tough.
Hypotheses are hard to get right, and most formats are designed to help you “validate” your ideas. But “validating” your ideas is a dangerous path (see Confirmation Bias).
Instead of looking for evidence that your ideas are right, you should try to find the issues within your ideas and fix them before you invest time in building them.
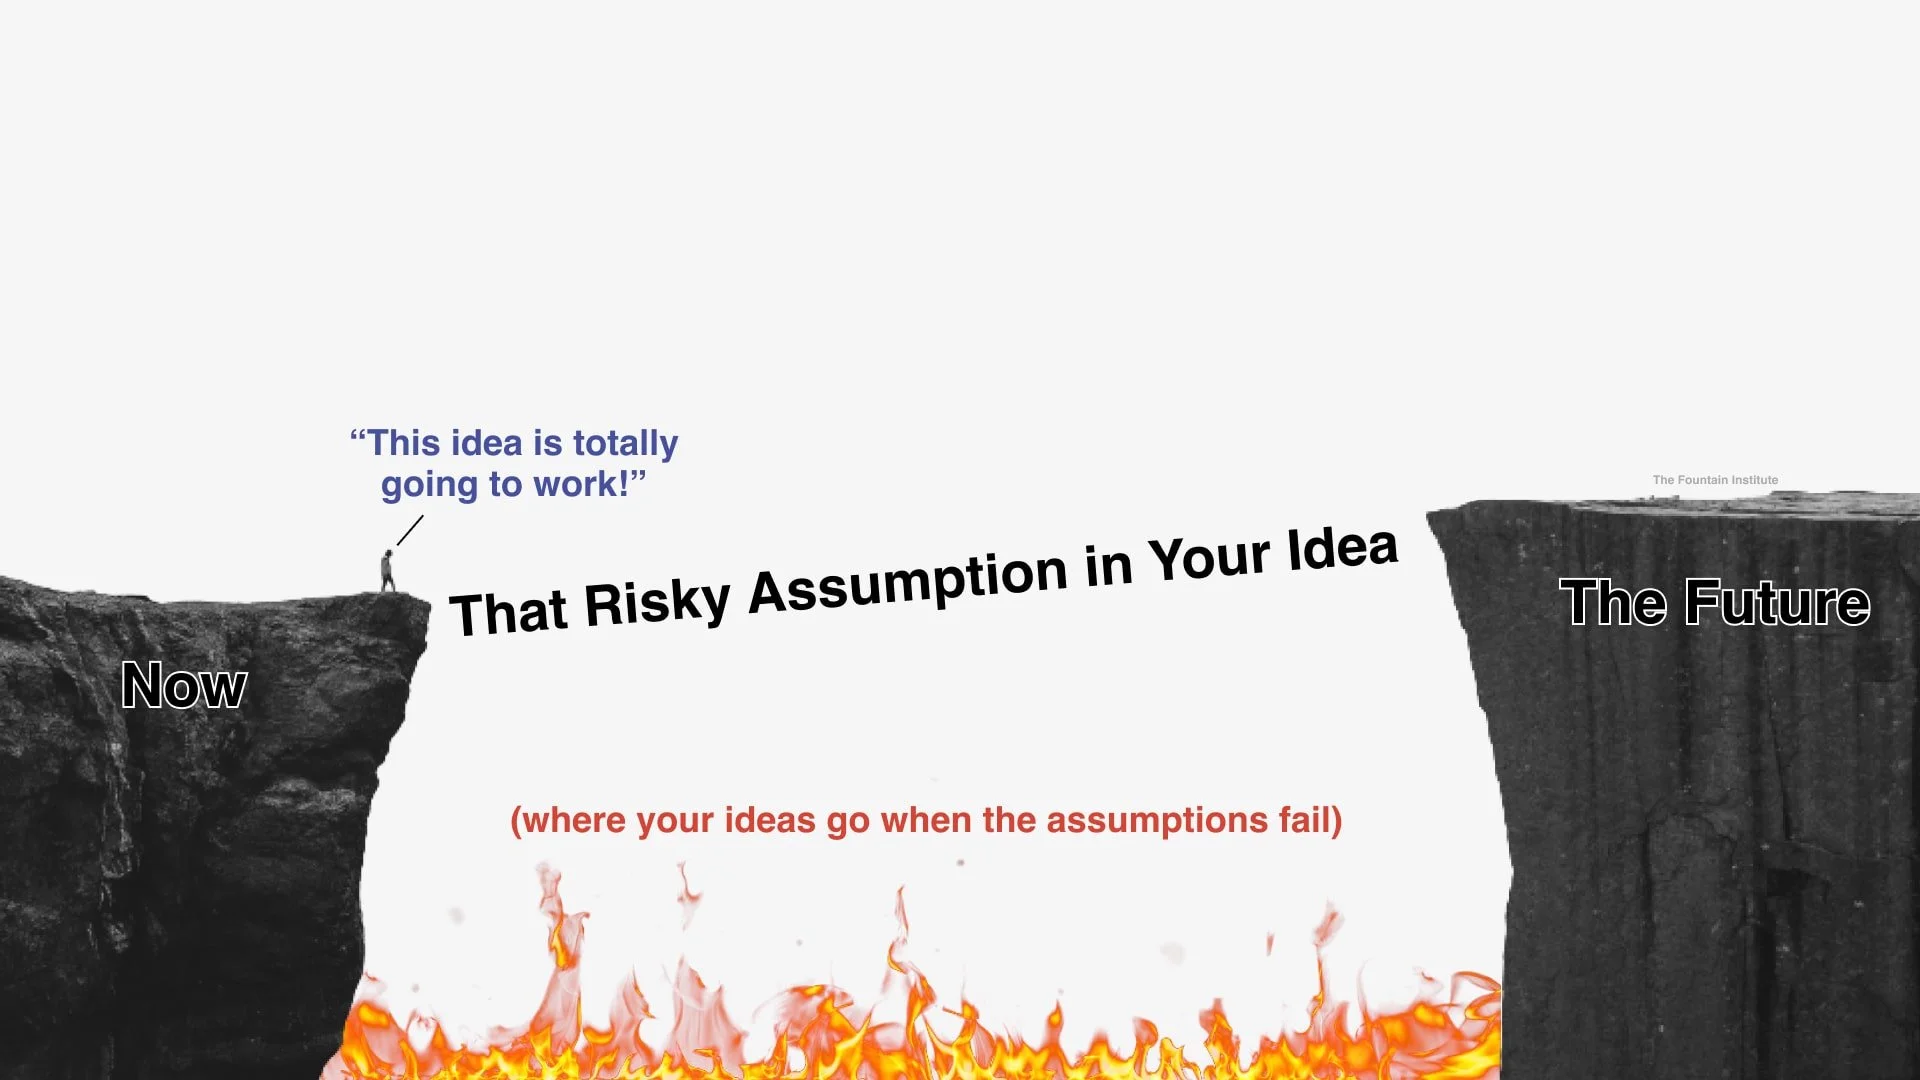
The Experiment Cards aim to do this by testing the assumptions within your ideas. Assumptions are the giant “leaps of faith” when you predict the future.
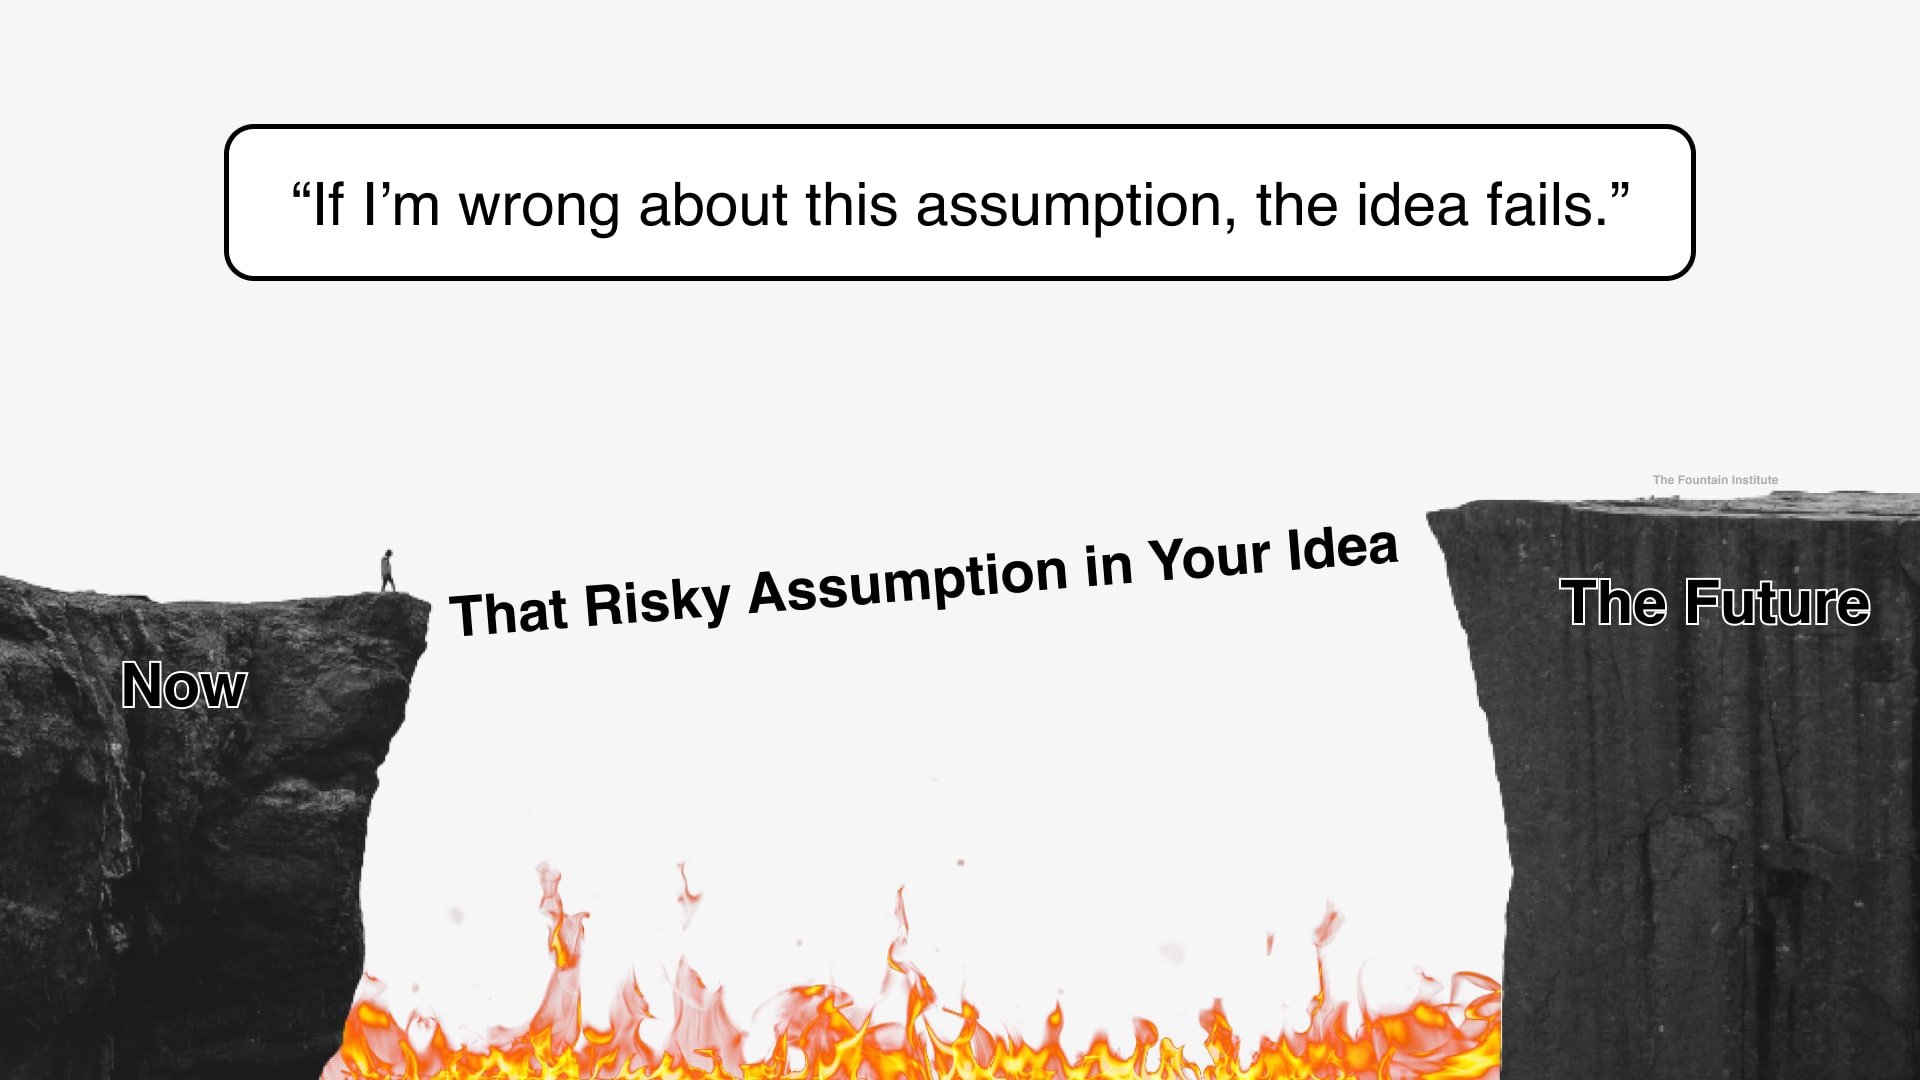
[from Niklas Laasch, adapted from xkcd]
Every idea is an assumption until it gets into a user’s hands.
Assumptions can kill products when they don’t match reality.
Experiment Cards help you take down assumptions like a trained mercenary. By targeting your riskiest assumptions first, you can iterate on your ideas based on customer behavior…not just what they say in interviews.
These cards are a solution discovery tool, meaning they work great after you’ve already done your background problem research. The Experiment Card can help make sure your solutions are worth pursuing before your team commits to publicly releasing anything.
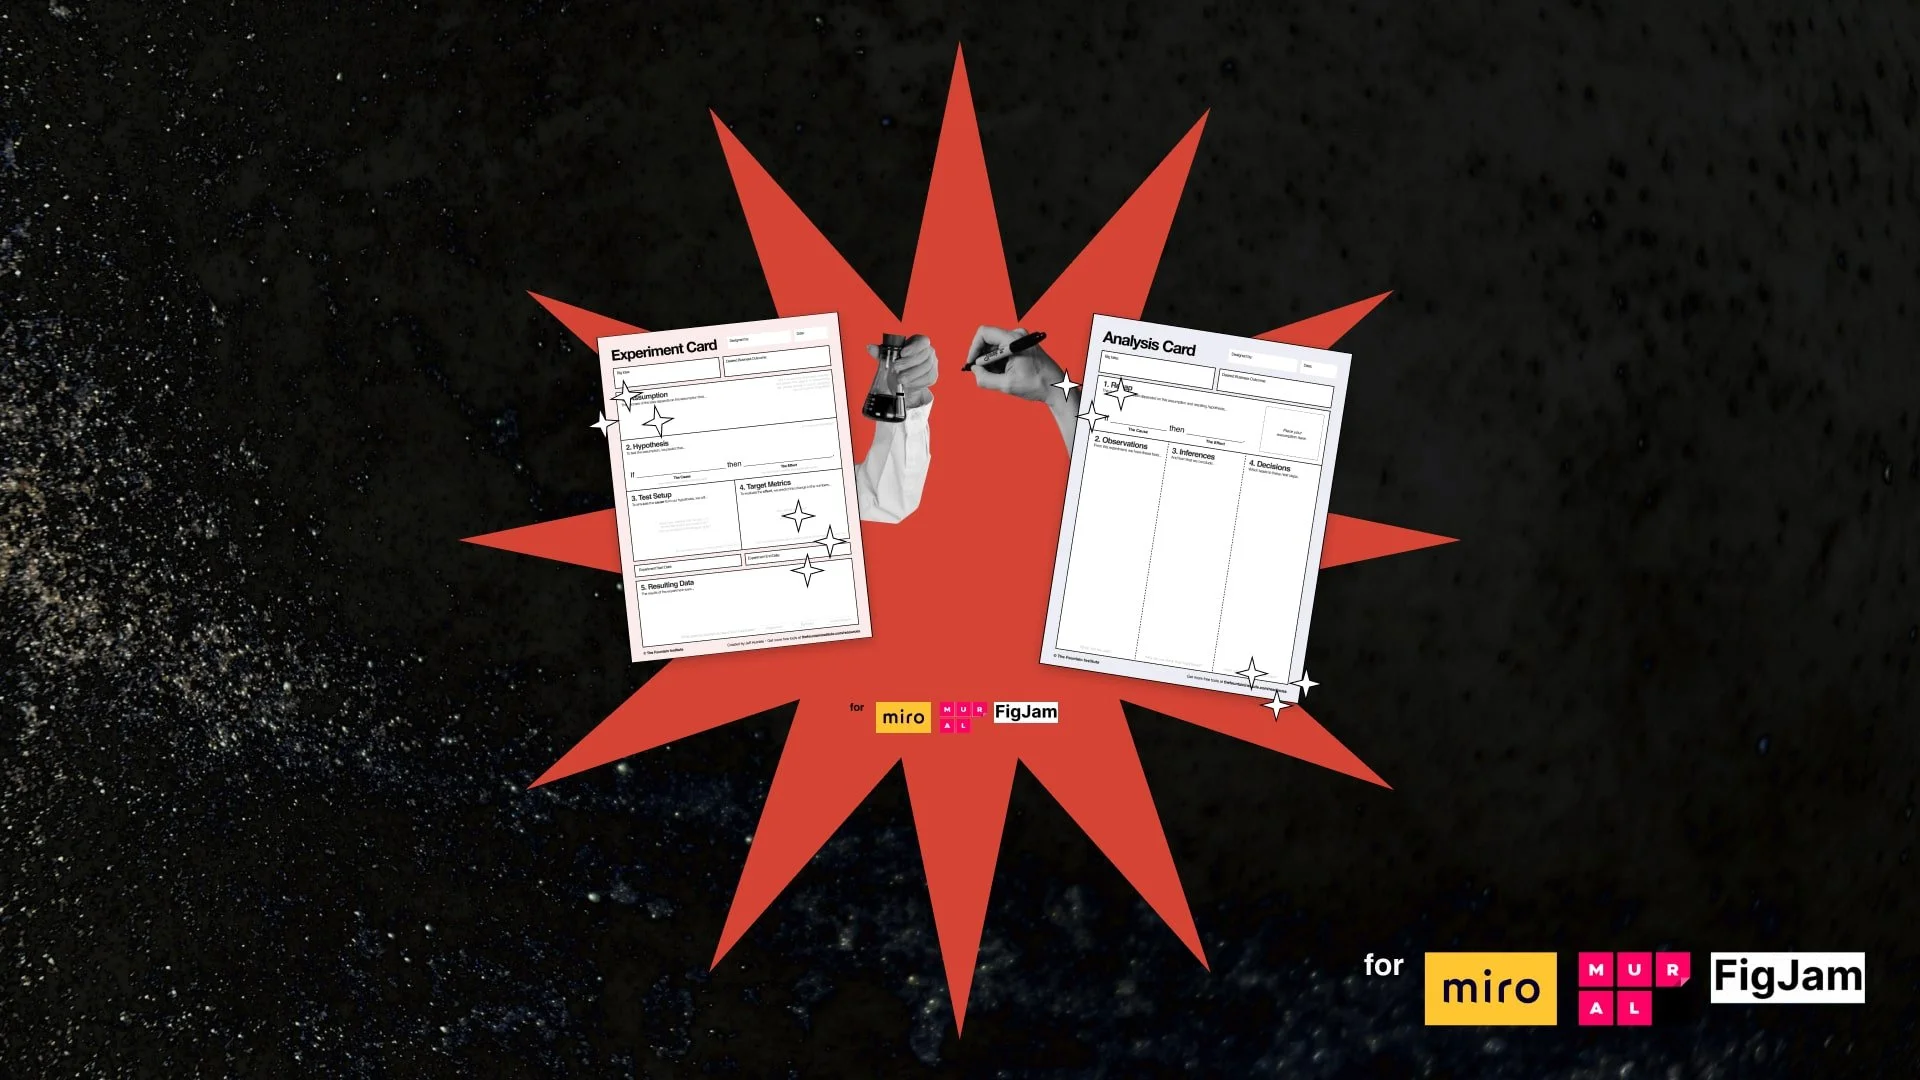
There are two cards:
The Experiment Card, filled out before you design the test
The Analysis Card, filled out after the experiment is over
Fill out the card with your team before your test in Miro, Mural, Figjam, or a similar tool. That way, you have a central place to plan and collect your experiment data visually.
The sections of the cards can be broken down into these phases:
The experiments you design will help you detect early signals of the success or failure of your assumptions before you invest time and money in a fully coded product.
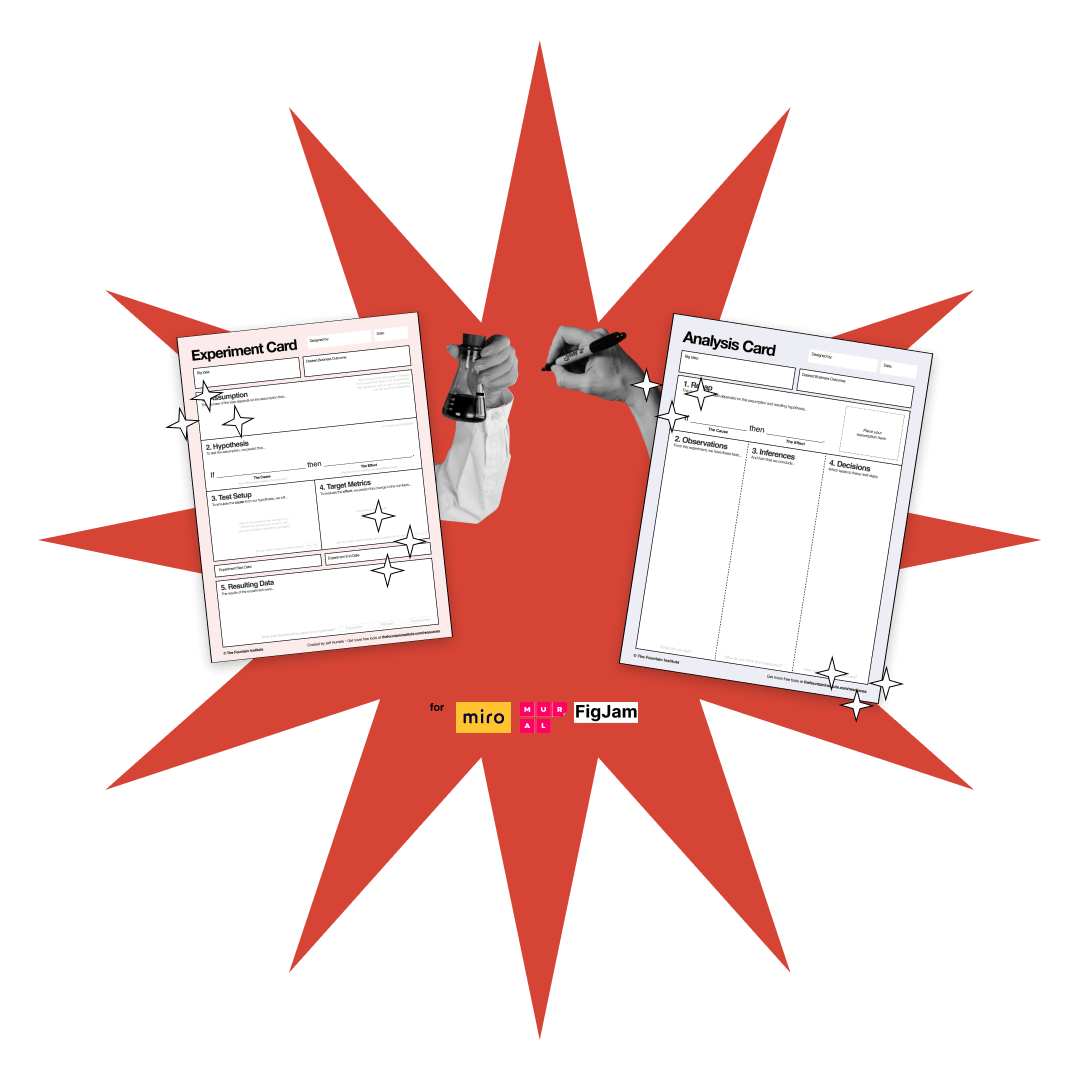
Experiment Cards
Turn product ideas into product experiments.
How to Use the Experiment Cards
How it might look to fill out an Experiment Card that tests a risky assumption
First, make sure your solution idea is based on research. While experimentation is another form of research, there’s no substitute for problem research before jumping to solutions!
We designed these cards for digital whiteboard tools like Miro, Mural, and Figjam. Drag the PDF into the whiteboard tool and iterate away!
Start the canvas at the top and work your way to the bottom. The prompts beneath the numbered header guide your research plan toward a specific goal.
We recommend that you fill out the cards with your team. The canvas cells are small, forcing you to edit to fit the space. If you run out of room in a section, try dot-voting with stakeholders until the post-its fit.
Ready to go? Let’s walk through each step of the Experiment Card.
Solution Idea
The solution idea is the most common starting point for the Experiment Card, but you could also test an idea related to a problem. Make sure your big idea is based on previous research and has a big enough payoff to warrant an experiment.
Keep the text brief but take the time to iterate through a few versions before starting. Your first wave of ideas will never be as good as your second or third wave!
Examples:
"Subscription Model"
"HMW offer a cheaper monthly rate for our product?"
Desired Business Outcome
Use the overarching business outcome that already drives your team rather than a project-specific outcome. Here are some possible business outcomes you can use if your team doesn’t have an explicit business outcome:
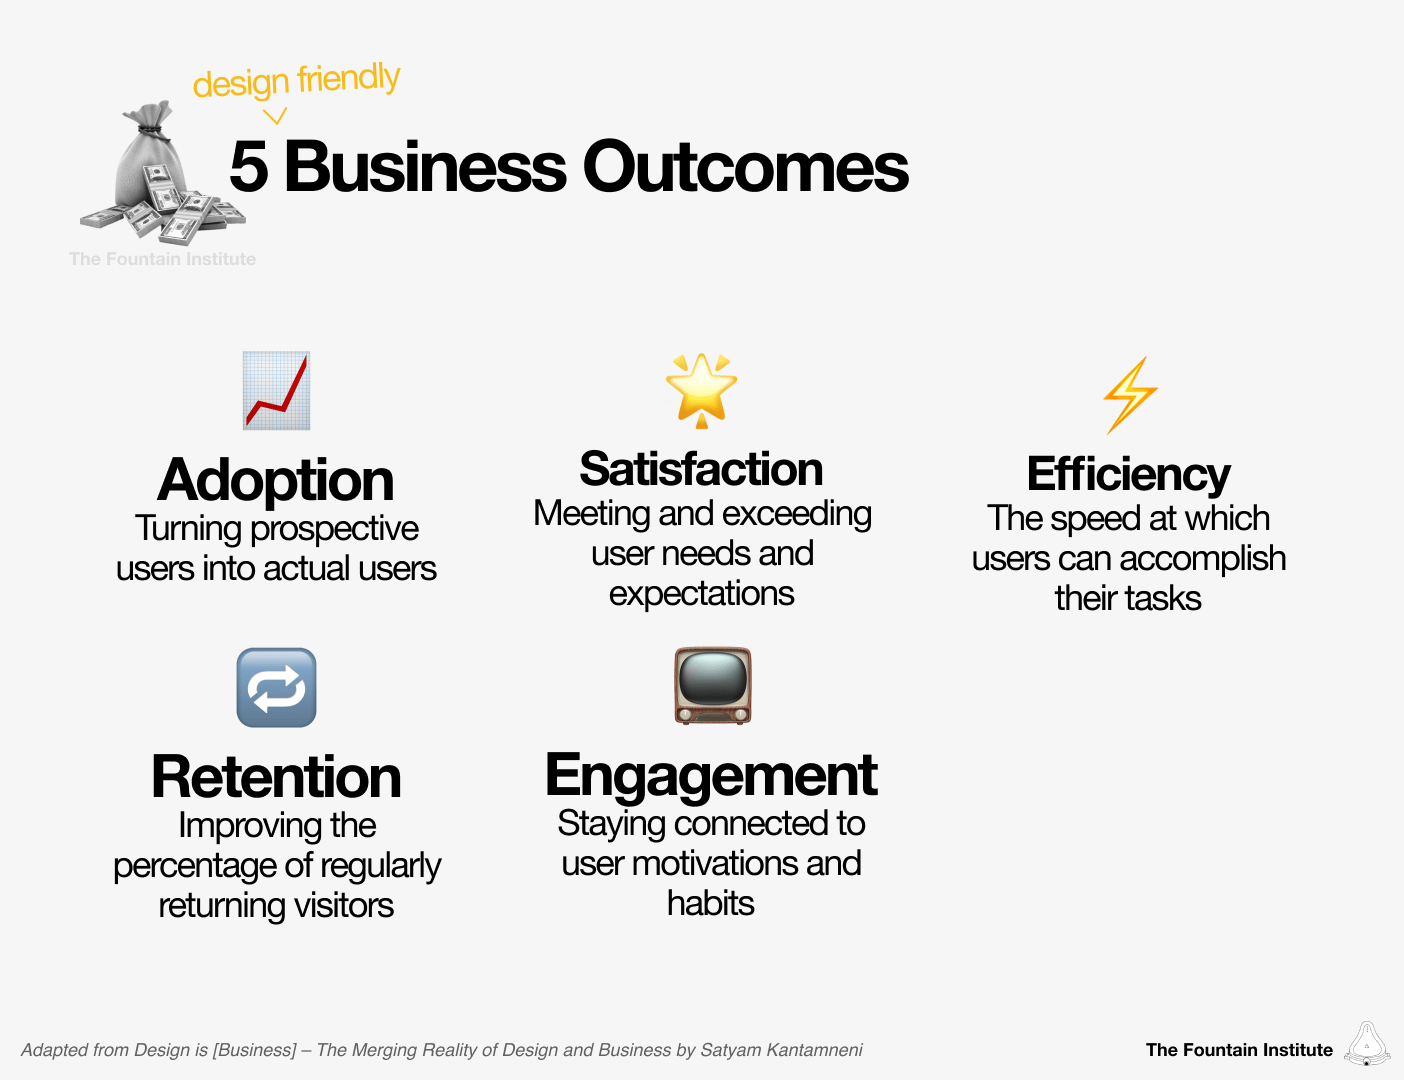
Adoption - turning prospective users into actual users
Retention - improving the percentage of regularly returning visitors
Satisfaction - meeting and exceeding user expectations
Engagement - staying connected to user motivations and habits
Efficiency - increasing the speed at which users can accomplish their tasks
Other - the best business outcome is the measurable business outcome that your team works toward already
1. Assumption
What are the assumptions behind your solution idea? There are always a few assumptions in your team’s ideas. De-risk assumptions with a test before investing time in a complete build.
Finding assumptions on your own is difficult. This section is a great area to collaborate with your team to make sure you're identifying all of the non-obvious assumptions.
We recommend Assumption Mapping or Experience Mapping to pull out the assumptions. Learn more about Assumption Mapping in our guide to experimentation for designers.
Pro Tip: It's easier to measure results if you focus your experiment on one assumption. Pick the riskiest assumption and set up your test based on that.
If you have a lot of solution ideas, they likely share assumptions. By testing risky assumptions upfront, you can de-risk multiple solutions and save time.
To help identify assumptions, you can use the four lenses of innovation. IDEO popularized the 3 lenses of innovation, but the design firm somehow neglected usability. We think that at least 4 lenses are needed for good products so we’ve included usability. After all, what is innovation without a usable product?
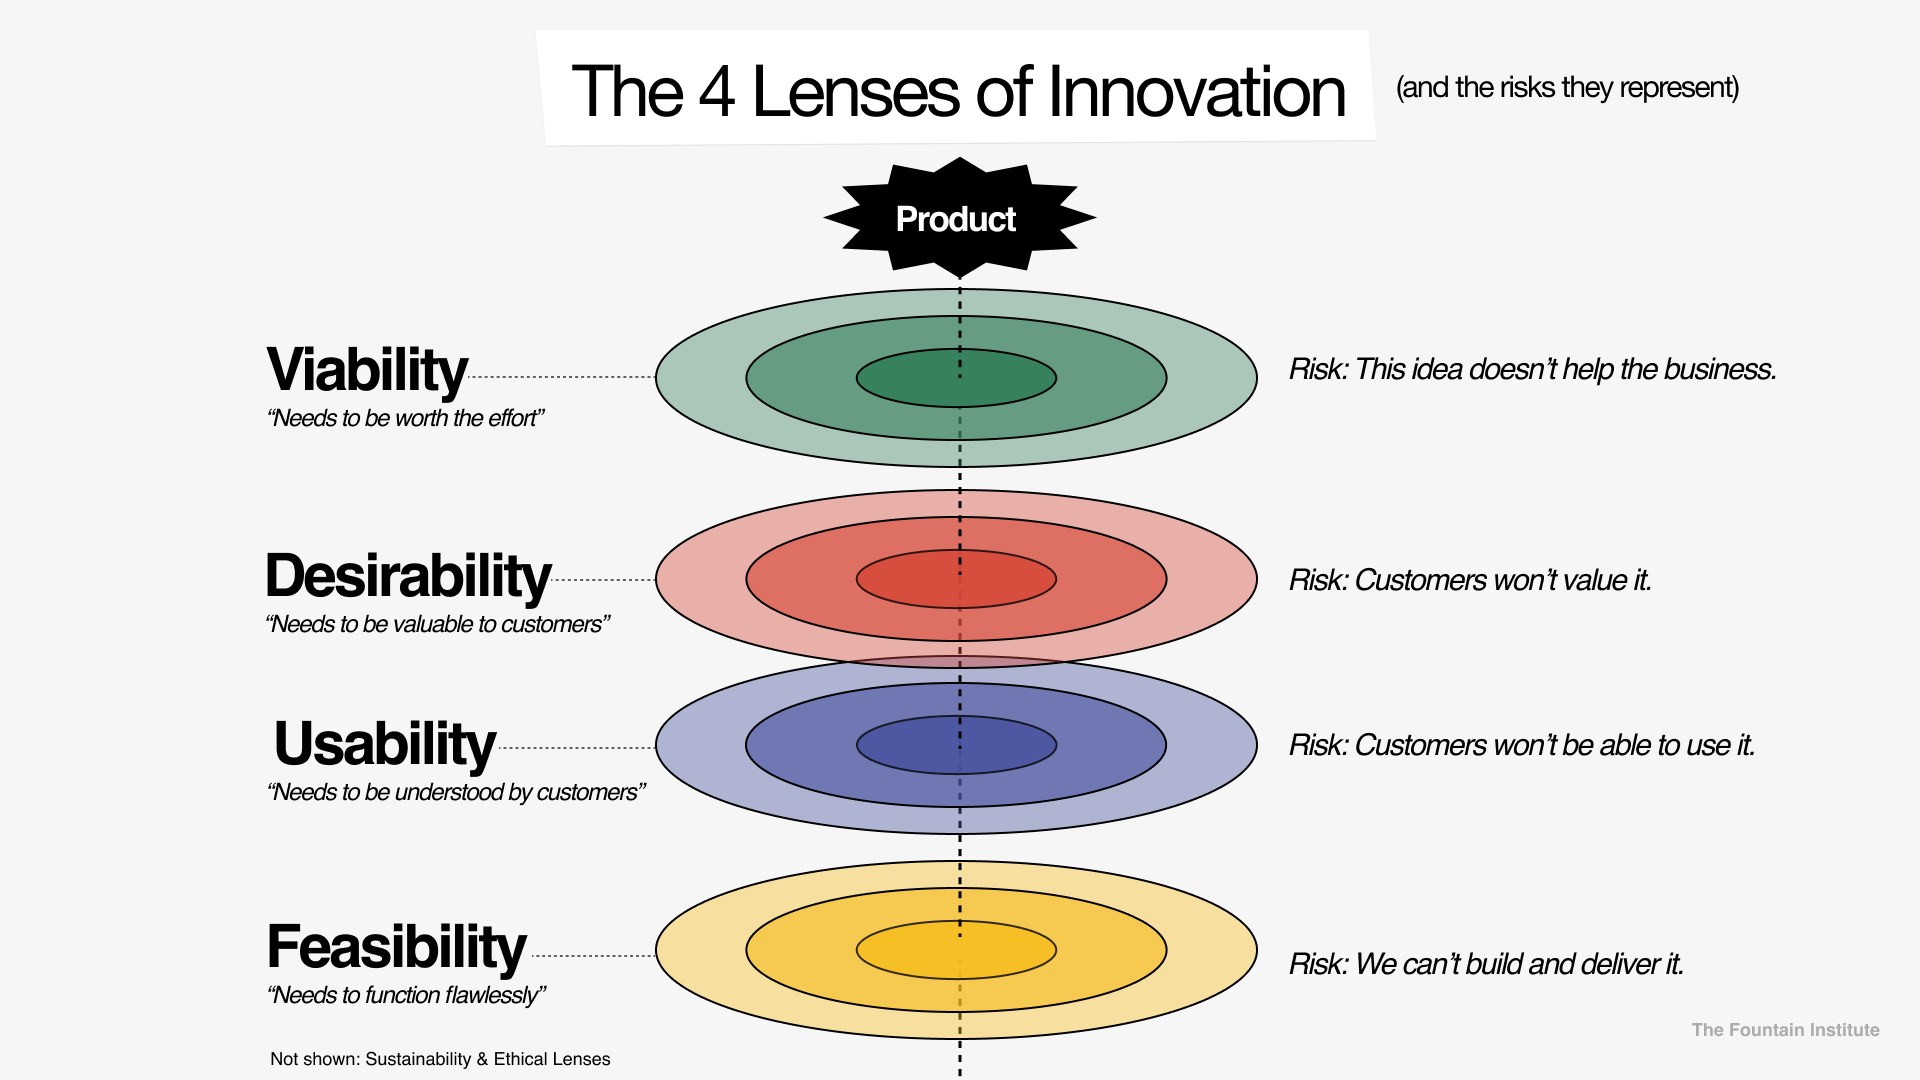
Use the 4 lenses of innovation to examine your idea and uncover assumptions. You’ll find these prompts in subtle gray text on the Experiment Card to guide you in this process.
Viability - Should we build it?
Desirability - Will users value it?
Usability - Will users understand it?
Feasibility - Can we build it?
Examples:
"Our users want to pay monthly, rather than yearly" (highest risk assumption)
"We understand the user expectations needed for a subscription model."
"A subscription model can be offered alongside a one-time fee pricing model."
Don’t try to pull out assumptions by yourself. You’ll be much more rigorous if you share the task of identifying risk with your team. If you work on a product design team, consider bringing in these experts:
Product Manager - experts in viability, feasibility, and desirability
Product Designer - experts in usability and desirability
Engineers - experts in feasibility
2. Hypothesis
Experiments aren’t experiments if they can’t be proven wrong. That’s why it’s essential to guess the expected behavior.
We are using a simple format to predict a cause-and-effect relationship. Cause-and-effect is essential for isolating variables and establishing causality later as your experiments mature.
If [cause], then [effect].
The [cause] or the independent variable can be simulated with a prototype or live A/B test. The [effect] or the dependent variable is the metrics you will use to evaluate the effect in your experiment.
That’s the most straightforward hypothesis format; I think it’s the best place to start.
Pro Tip: If past research informs your hypothesis, link it next to your card. The research that informs your experiment is known as the hypothesis rationale. Hypotheses should have a rationale based on prior research or experiments. You’re making a bold prediction with your hypothesis, so you want it to be based on as much data as possible. We recommend you link to the research or rationale that informs your hypothesis. Summarizing the past research will help you and your stakeholders understand the thinking behind your hypothesis.
3. Test Setup
The Test Setup details what you will do to simulate the cause stated in your hypothesis. Think of this section as a way to plan exactly what you will do in the experiment.
Describe what you will do to tackle your assumption. Use this section to discuss any designs you will create and who you will test them on. Aim for a Minimum Viable Experiment (MVE) here, not the Minimum Viable Product (MVP).
Prioritize test approaches that create learning. Once you've validated the riskiest assumptions, you can follow up the test with more polished designs.
Questions to ask yourself:
What's the quickest way to test this assumption?
How might we simulate and prototype early?
Is there an easier way to evaluate this assumption?
How can we get an early signal that we're on the right track?
Example:
“We will run a click test with potential customers to see if they click subscription rather than one-time payment when given a task”
4. Target Metric
The Target Metric goes into more detail about the metrics that will represent your predicted effect. Think of this section as a place to describe specific numbers representing the effect in your hypothesis.
The Target Metrics state what needs to be true for the assumption to be supported or refuted. This is a bold target that attempts to predict the impact that the experiment will have.
When you start running experiments, setting a reasonable target for your experiments is hard. Don’t worry, you will get better in time. Do a little research into any related metrics you can access through analytics and base your target on that.
Use these questions to ensure you format your metric properly:
Who: Who will be impacted?
How much: By how much will they be impacted?
When: In what timeframe will they be impacted?
If your metric answers those three questions, it’s a good metric. Metrics can always improve, but those three criteria are the baseline. Ask a data scientist or a business analyst if you want to improve your experiment metrics beyond these three questions.
Make sure you write these before you start gathering data. Target metrics are like “calling your shot” when shooting the eightball in billiards: If you don’t call it out before, it doesn’t count.
By defining the success or failure metrics beforehand, you can avoid Hindsight Bias, the psychological term for when you convince yourself after an event that you accurately predicted it before it happened. With experiments, we want to avoid the mentality of “Let’s see what happens,” commonly called a “Spaghetti Test.”
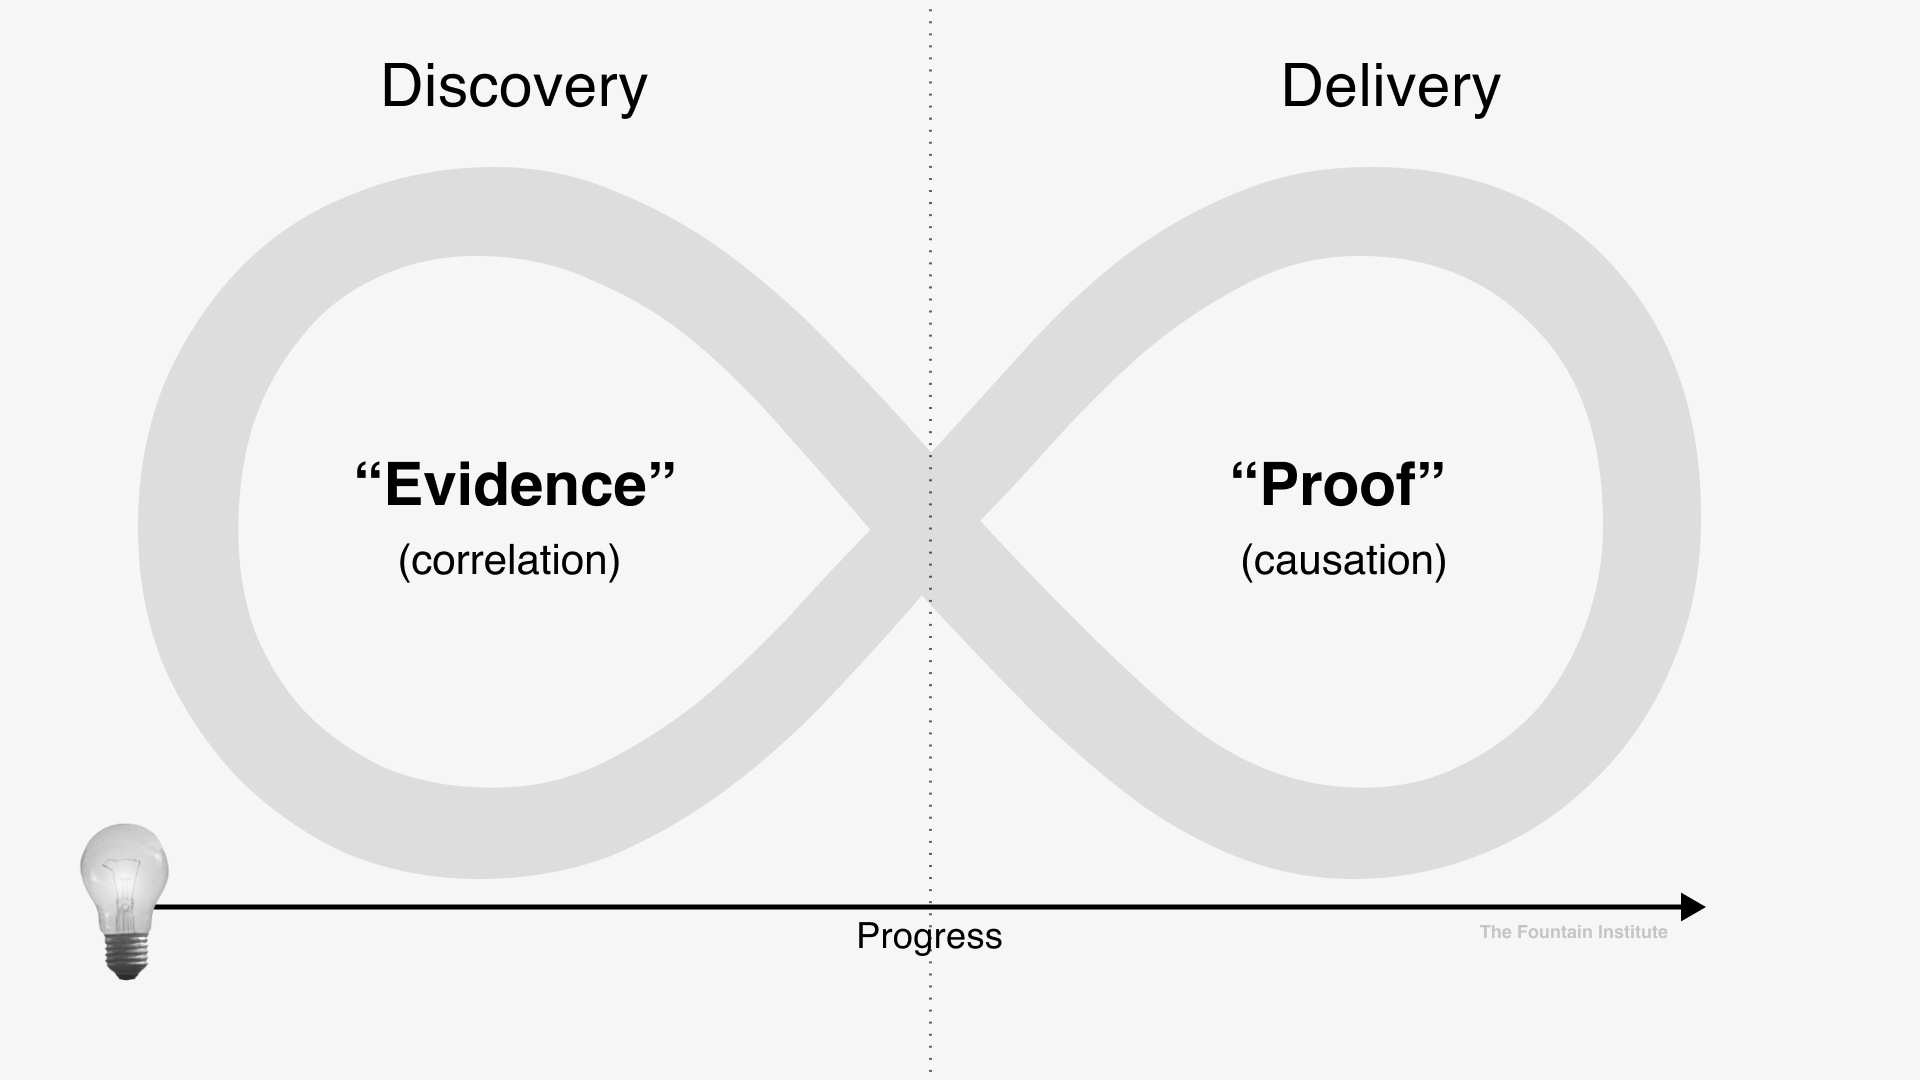
As you conduct experiments, your metrics will change depending on where you are in the process.
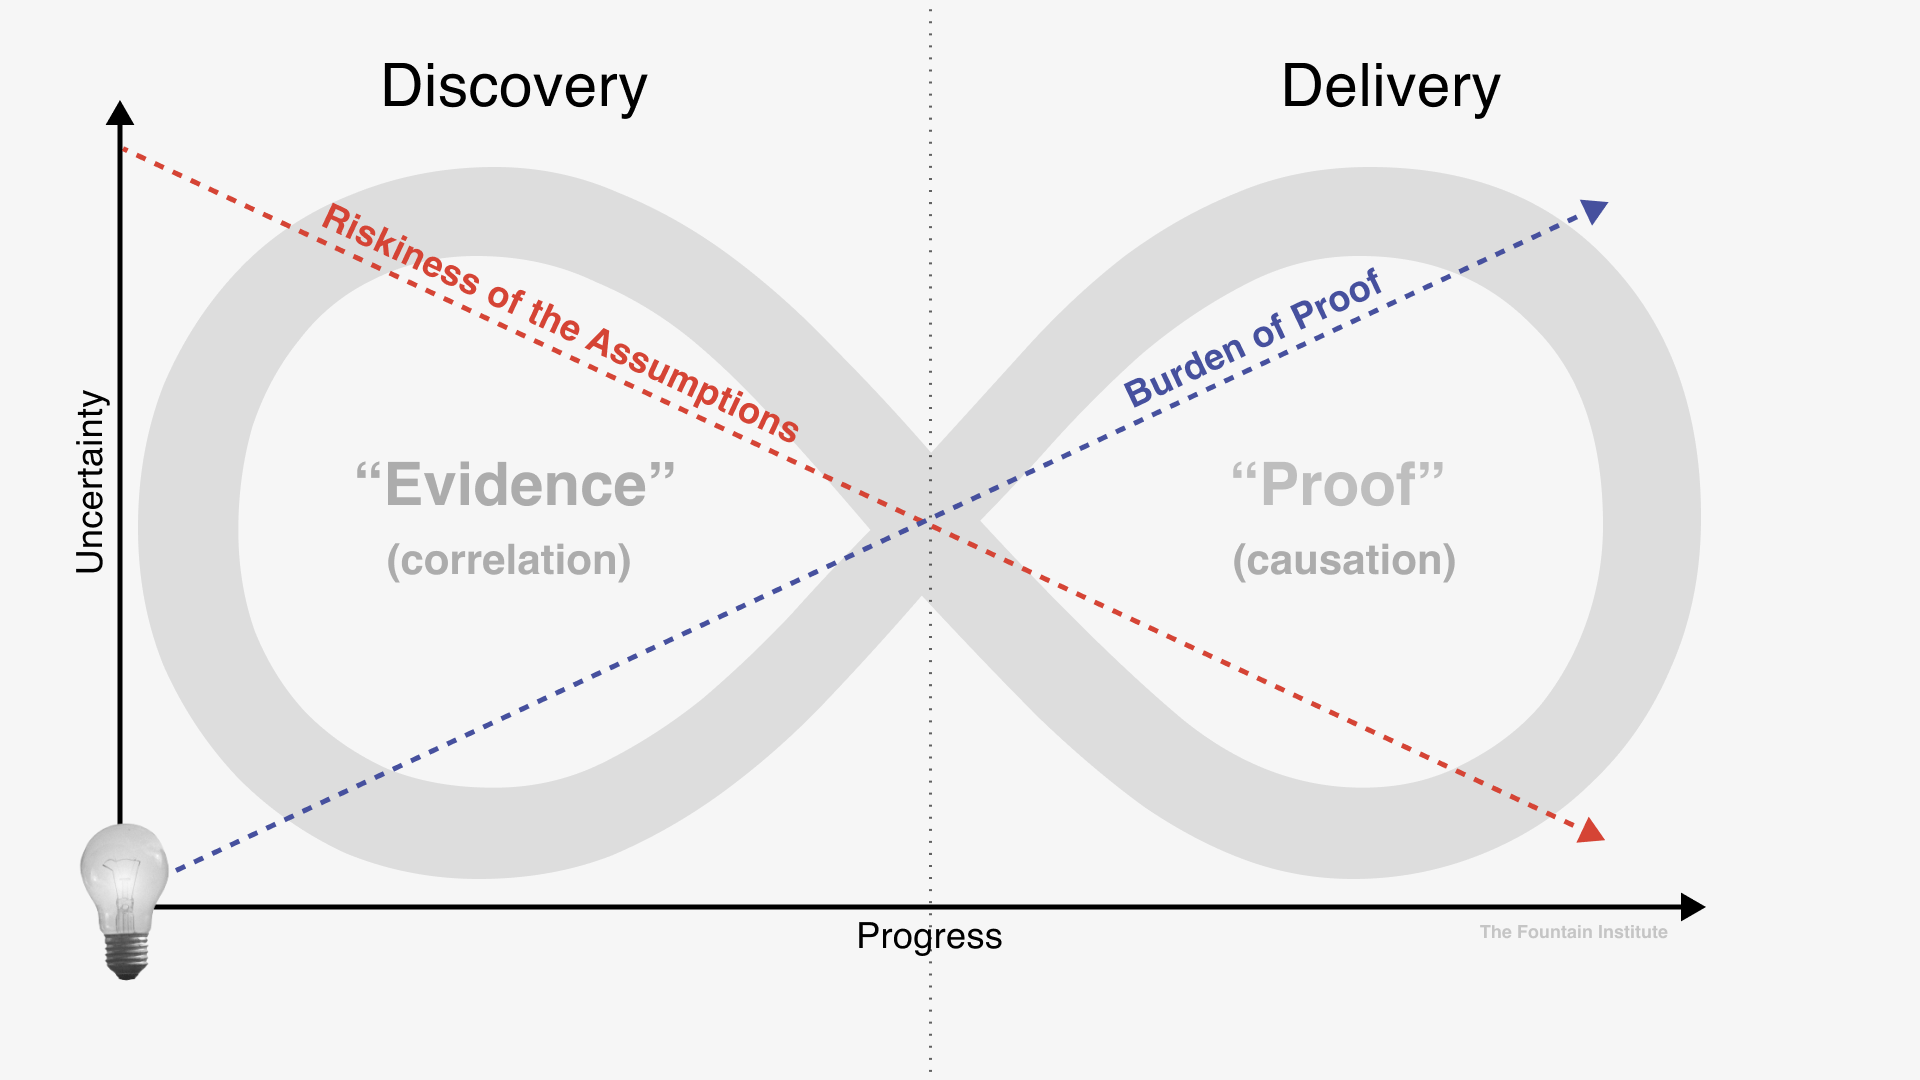
When you’re in the early Discovery Phase, your burden of proof will be lower than in the later Delivery Phase. As you move closer to delivery, the burden of proof increases, making your metrics slightly different in the Delivery Phase.
[Concept adapted from Testing Business Ideas by David J. Bland]
An early discovery experiment might give you lots of evidence with only ten users involved. When ideas are early, any evidence you can generate is useful. If you’re running experiments with low numbers, the results might be due to noise, but that might be unavoidable if you don’t have access to lots of testers. Run a series of experiments to counteract your low numbers and work towards testing with larger groups where you can achieve statistical significance.
A delivery experiment such as an A/B Test will have a higher burden of proof, and the results should be statistically significant.
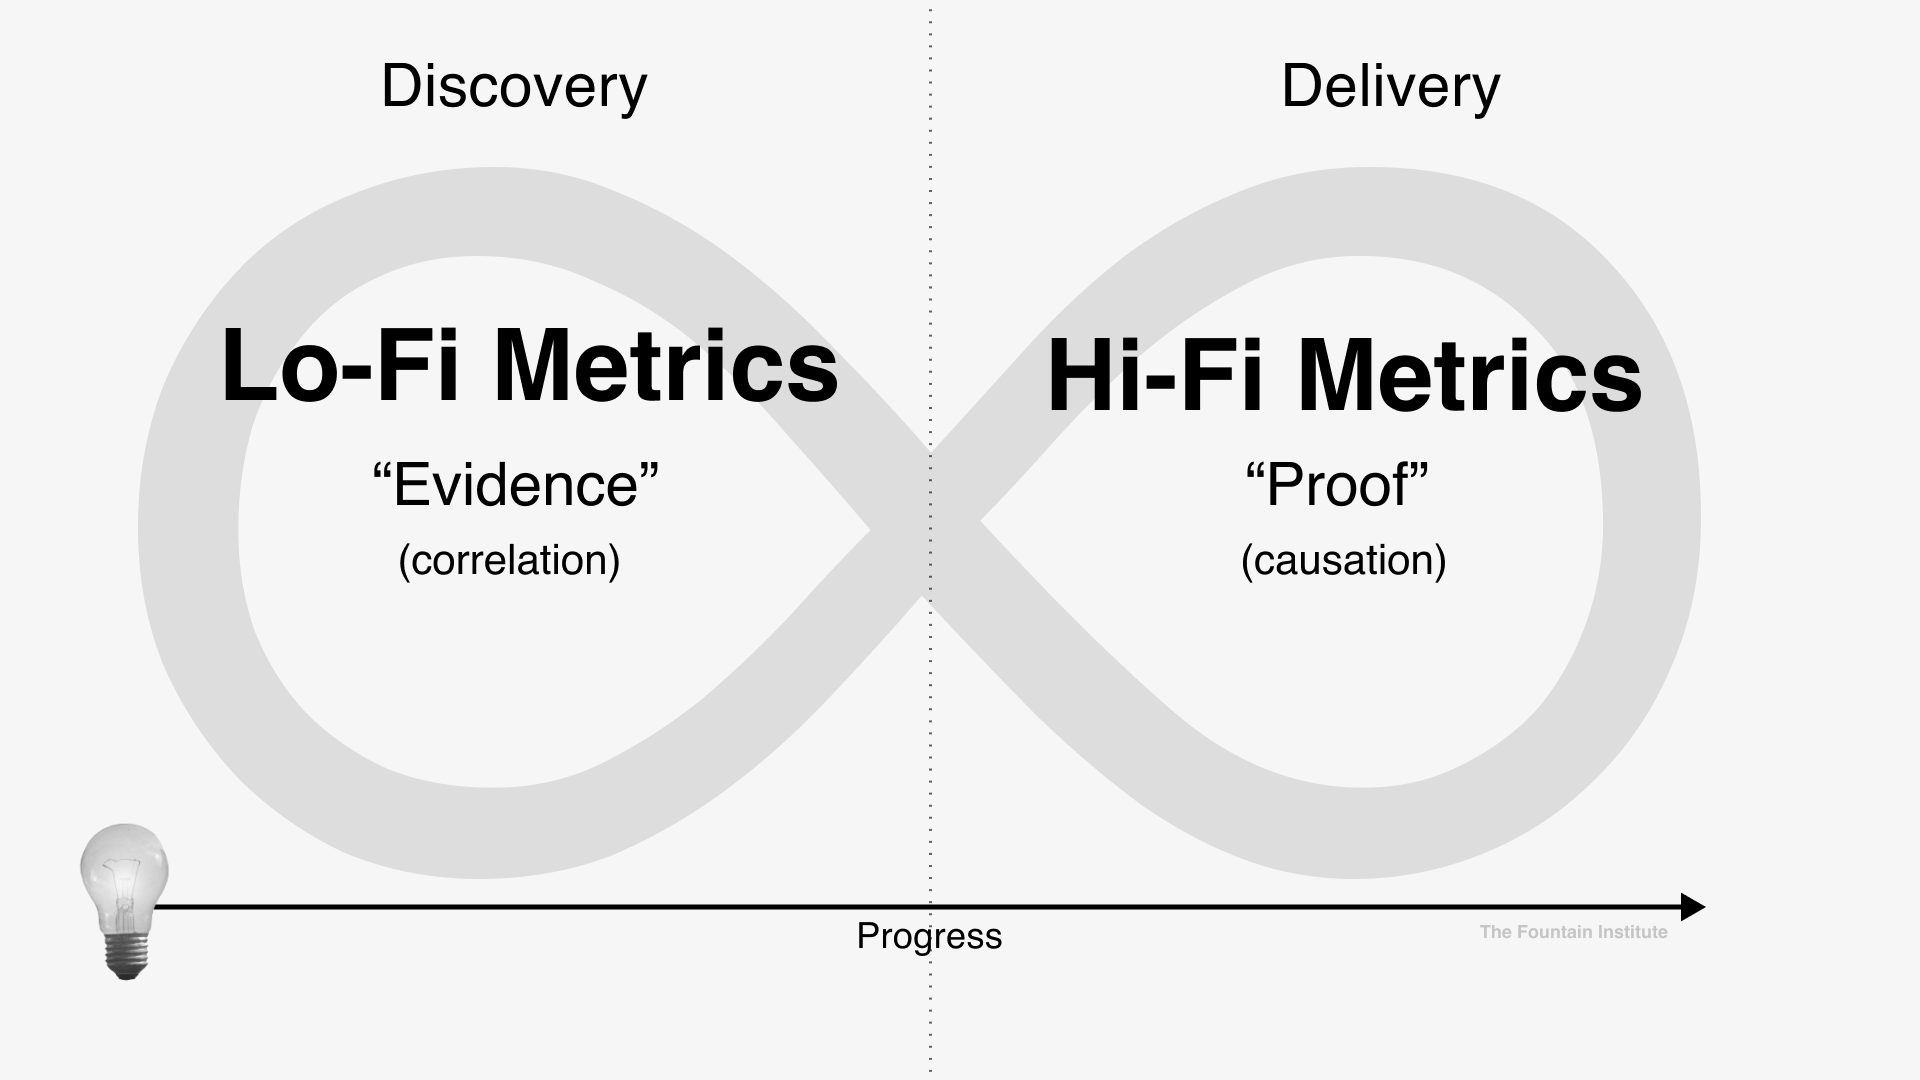
Lo-Fi Metric:
“In this click test, 6 out of 10 testers will click subscription links in the prototype during the test” (Discovery Experiment Metric)
Hi-Fi Metric:
“The launch of this subscription option will increase adoption for new customers by 25% after 30 days” (Delivery Experiment Metric)
Stakeholders often have high expectations for precision, but the more precise your measurements, the more the experiment will cost. Make sure you know the costs involved to achieve statistically significant results. Hi-fi metrics with 95% statistical significance (common in science) might cost more than most stakeholders are willing to pay for the results. Discuss this with your team before you make assumptions about your experiment metrics.
Experiment Start & End Dates
Time is a very important element of your experiment planning. If you are testing with low numbers, you may have to run the test for longer than you think.
For longer experiments, it can be tempting to stop measuring when you see early results, but those results can fluctuate quite a bit during an experiment. By marking the beginning and end of your measuring period, you will ensure that you stick to the schedule.
5. Pre-Test Decisions
There are three possible outcomes for any experiment:
The hypothesis is supported
The hypothesis is refuted
The results are inconclusive
Knowing this, try to get the team to agree on what you will do in these three scenarios. And make sure you write this down BEFORE you run your experiment. Deciding this before will protect you from stakeholders changing their minds after seeing the experiment data (Hindsight Bias). By putting the decisions in writing, you can hold the team accountable for the user data you collect.
How to Use the Analysis Card to Run an Experiment Retro
How it might look to run an experiment retro with an Analysis Card that sparks new ideas
Experiments should be iterative learning cycles, and the Analysis Card closes the experiment cycle. The Analysis Card also keeps the team from forgetting to measure and learn from the results.
Without a retro, you might "forget" about an experiment that didn't go well. That's why we recommend setting a date for the Analysis Card as soon as you fill out the Experiment Card. Setting the data beforehand allows you to remember to check in on the results.
Think of the Analysis Card as a reminder to share and improve at experimentation. Fill out the card in the following order.
1. Resulting Data
After your measurement data, you can gather the results from your experiment. This space is big enough to screenshot a graph or other visual data element.
Be transparent about your results. Here are some tips for presenting data on your card:
Include a visual like a bar chart or a line graph
Show both numerator and denominator, rather than using percentages for small audiences of less than 100
Write whole numbers like “25” rather than “25.03” when you are testing with small audiences of less than 1,000
Write down your “confidence interval” if you average results or have a big margin of error.
Note if you achieved statistical significance (not due to chance) with the results
It's a good idea to also "call your shot" with the decision connected to this experiment.
There are three possible outcomes for any experiment:
The hypothesis is supported
The hypothesis is refuted
The results are inconclusive
Pro Tip: Since there are three possible outcomes, you can call your shot by making decisions before the experiment. Facilitate team decisions on the three possible outcomes before you start the experiment. I like to write down a possible decision for each outcome in a Post-it below the Experiment Card. You may not have the agency to make those decisions, so bring your team lead into this process.
2. Facts
Write down what happened during the project. This is a great place to record customer behaviors worth capturing as an experiment. You can include screenshots or links to the data here as well.
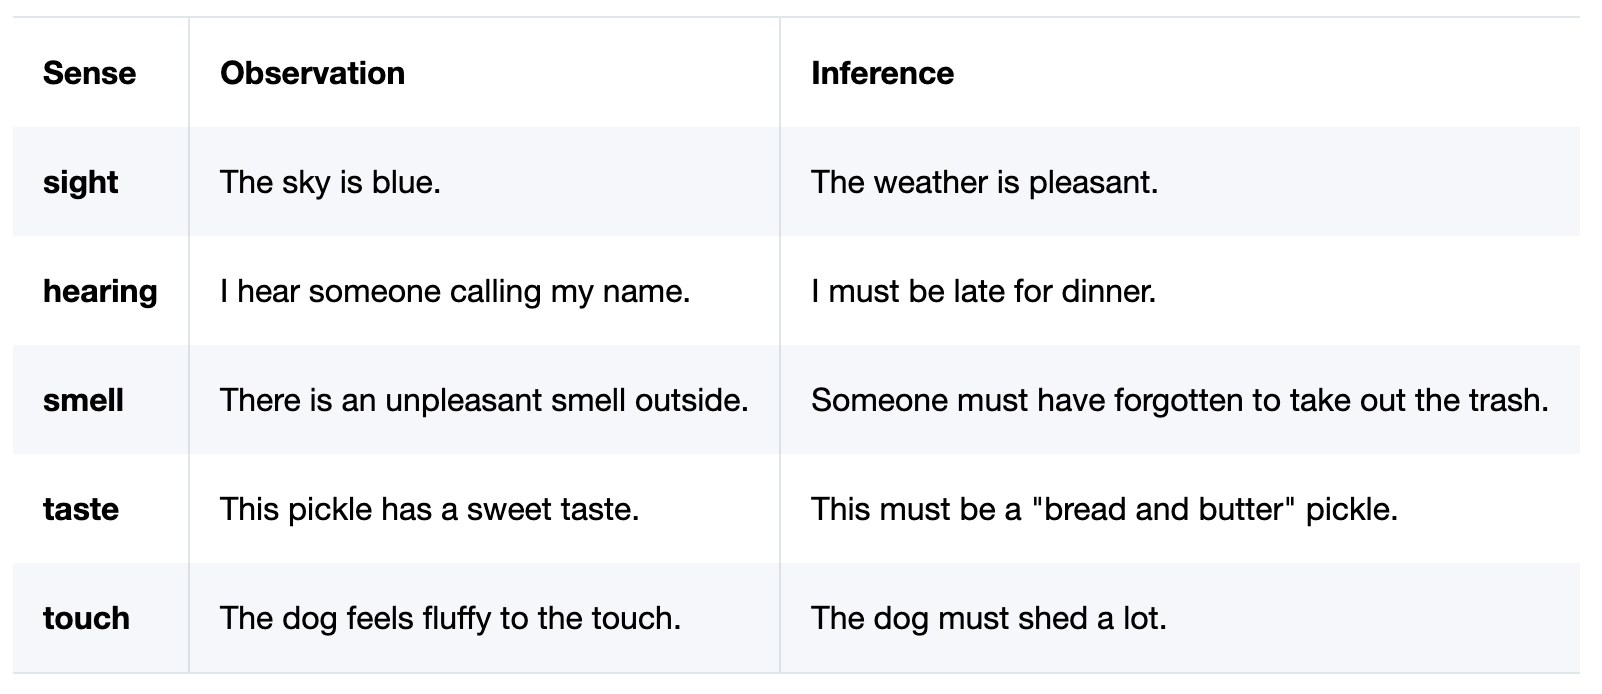
3. Inferences
What are the facts from the test? What prior facts can you combine with this experiment to create a new inference? Write down what you learned before you forget it! This space is a great place to revisit when planning experiments.
What’s the difference between an observation and an inference? An observation is based on the five senses. Inferences are conclusions drawn from those facts. Here are some examples:
4. Recommendations
Write down what decisions you will take due to your observations and inferences. Documenting these is essential so that you have them for review later.
If you encounter resistance, remind your team that data-driven product companies make decisions this way, even if it’s painful.
Close the loop by writing down the steps you will take during the experiment retro. Don’t forget to assign people to the action items to improve accountability. That way, you’ll be sure to complete the action items before the next experiment retro.
Congratulations! You’re ready to try your first experiment. Here’s what the full process might look like:
The Experiment Design Process in Product & UX
Make sure your solution idea is well-researched before you test it
Fill out the Experiment Card before you design anything (involve your team).
Design a prototype that will test the assumption/hypothesis in your experiment.
Launch the experiment.
Wait.
Collect the experiment results in the Experiment Card.
Meet with your team to analyze the results in a mini retro.
Use the Analysis Card to discuss the data from the experiment (Involve your team here).
Learn from the data.
Start the process over again with the next Experiment Card!
You can use the Experiment Cards for both early-stage innovation and late-stage optimization. You can tackle your most significant assumptions in discovery or delivery and de-risk your ideas with confirmed customer data.
Remember, run a series of experiments, not a one-off testing event. Experimentation works best when it’s continuous.

Experiment Cards
Turn product ideas into product experiments.
Learn More about Designing Experiments
Read The Designer’s Guide to Testing and Experiments and learn the experimental mindset needed for assumption testing
Read What is Data-Driven Product Design? and learn about the way to approach data and decision-making when designing experiments
Read 3 Ways to Design Better A/B Tests if you want to design A/B tests
Advanced Experiment Concepts
WARNING: The following concepts get into statistics. Only use this section if:
You are trying to achieve statistical significance with your results (see below)
You are running a high-risk experiment where everyone seems to have high standards for numbers
You want to infer precise conclusions about things beyond the samples in your experiment (you probably do)
Statistical Significance
This is a fancy way to say, “These numbers are not due to chance,” and it describes your confidence that the effect you see is related to the cause being studied rather than random noise. Statistical significance talks about a relationship between two numbers.
Let’s be honest; you’re only curious because business stakeholders often ask about it. My theory is they think it makes them sound smart. Usually, they don’t know what it means, but you should.
Here’s how I would put it. If your numbers reach a certain level, they become accurate enough to be “trustworthy.” Of course, that level depends a great deal on the context. Scientific experiments are all about repeatability, so it’s common to be okay with achieving 95% statistical significance. For business experiments, you can usually be ok with 90%.
That means for our 95% statistical significance experiment in science, you could be wrong 1 out of 20 times and never even know it. But thanks to math, we know that the likelihood of the numbers being off due to random chance is 1 out of 20 or 95%.
95% might be overkill for the business environment. How far you go down is up to you and your team. I would make 90% my default statistical significance standard, and I might even go down to 80% for a startup willing to bet on something big. But that’s just me. Read a better, more technical definition of Statistical Significance from Jeff Sauro, a designer with a Ph.D.
Null Hypothesis & Alternative Hypothesis
Behind every hypothesis in the Experiment Card is a null hypothesis. The null hypothesis is the alternative possibility for your experiment and balances the hypothesis on your card.
In statistics, they use a formal method for making conclusions about experiments that say behind every conjecture. There should be 2 possible hypotheses: the null hypothesis and the alternative hypothesis.
The null hypothesis (often written H0) says that there is no effect in the population
The alternative hypothesis (often written H1) says there is an effect in the population
The null and alternative hypotheses make claims about the broader population in your hypothesis. In many design experiments, your population would be all your users rather than just the ones you tested.

[from Null & Alternative Hypotheses | Definitions, Templates & Examples by Scribbr]
We need statistics to make claims outside of the sample (the group you collected data from i.e. your testing participants) that are accurate. In order to statistically significant claims about the population (the entire group you want to make conclusions about i.e. your full user base).
If you’re not trying to make broader claims about populations that aren’t in your experiment, don’t worry about the null hypothesis.
The hypothesis shown on the card is the “alternative hypothesis” (H1 above). Since we start this process with assumptions, many cards end up with what’s called the alternative hypothesis.
Here’s an example that you might see in UX design:
Alternative Hypothesis Example: “If users click the new button, then they will go on to purchase at a higher rate.” (put this one in the card)
Null Hypothesis Example: “If users click the new button, then it won’t affect purchasing rates.” (not shown on the card)
Language is important in statistics so be careful about using the words “validated” or “proven.” While you may think it’s ok to infer from an experiment that you have “proven” your hypothesis, you haven’t. Hypotheses can only be supported or refuted. Null hypothesis are more scientific because you can refute them more easily than an alternative hypothesis.
If you want to do more scientific experiments, collect evidence until the Null Hypothesis looks ridiculous. This will ensure you’re rigorous in your experiments. Read more about the Null Hypothesis and Alternative Hypothesis from this academic blog.
If your data scientist asks, the Experiment Card prompts for a “directional alternative hypothesis” (also known as a directional research hypothesis). This research hypothesis claims a positive or negative correlation between two variables. A directional hypothesis claims the direction of the results. It is called a directional (one-tailed) hypothesis because it states that the results go in one direction. You can use a one-tail T test to check your target metrics against a smart baseline to analyze your research data.
Default Action
The Default Action is what you will do if the data doesn’t change your mind. It’s the default thinking or the way things are…that is, until experiment data potentially changes your mind.
The default action isn’t shown on the card, but it’s good to know what you will do unless the experiment results change your mind. The default action is what you’re up against when you design an experiment around a new design.
Example:
“Our default action will be to keep the product the same unless the experiment changes data changes our mind.”
Knowing the default action helps you understand the null hypothesis better.
Most business owners will prefer to see your experiment data before deciding. So you may not know what the default action is for your team. If you can gather the default action, it will help you understand your null hypothesis and more easily analyze your experiment data.
If you want to run advanced experiments, try to set up pre-test decision-making before you run the experiment. That way, your team won’t fudge the numbers or look for ways to prove the hypothesis later.
Advanced experiment design process for product & UX
Ask the team to write down the pre-test decisions they will take if the hypothesis is supported, refuted, or inconclusive
Get everyone to agree on the decisions before running the experiment
Fill out the Experiment Card
Run bold experiments that can potentially refute the null hypothesis (opposite of the alternative hypothesis simply called the hypothesis on your card)
Take the decisions in your card
Evaluate your assumptions based on the experiment data
Update or move on to another risky assumption
Not sure when to stop testing? Keep testing until the null hypothesis looks ridiculous. Read more about this concept from Cassie Kozyrkov, Head of Google Decision Intelligence.
Causation vs. Correlation
You want to do just enough experimentation to de-risk your riskiest assumptions in product innovation work. You don’t have to establish causality or “proof” of your idea at first. Sometimes, correlation or even a bit of behavioral data is enough to make decisions and move on.
To determine if you have a causal relationship between your cause and effect, you must reach statistical significance with your test. To determine if your test results meet this math standard, use an A/B test calculator like this popular one from Evan Miller.
When product ideas are early, we’re seeking evidence of any kind. Product experiments can reveal useful correlations that you can later use to establish causality. The important thing is that you are running a series of experiments. Experiments shouldn’t be a one-off event.
When you're early in the product creation process, the hypothesis will be more of a guess, but as you run more experiments, the hypothesis will move from correlated sets of variables to causally related variables.
Example:
“If we offer a monthly subscription instead of a one-time fee [CAUSE], then we will convert more customers [EFFECT].”
NOTE: Consult with a data scientist or analyst before using the words “proved” or “because,” as these words indicate causality. Statistics sometimes go against common sense, and it will be helpful to have an expert improve your experiment design skills when you get to the level of proof and causality.
Read more about causation vs. correlation from Amplitude, a very good tool for measuring products
Free Masterclass on Experimentation & Assumption Testing
If you want to dive deeper, check out this free 60-minute webinar on how to design product experiments from the author.