Design Better A/B Tests in 3 Steps

This meeting has been going on for three hours: one ego vs. another. You sigh as you hear another "Our users want this new feature" An hour ago, you forgot which idea was fueled by ego and which was fueled by research. You agree to set up a test to get back to your desk.
Testing ideas can take personal opinions from the equation and move on when we need evidence, but A/B testing is complicated. Designers tend to be more highly trained in qualitative research (luckily, that is changing). If you’re not used to quantitative research, you might be unable to trust your instincts.
Try these things when you’re just starting to A/B test.
Use an A/B Test calculator
Test bold changes, not minor tweaks
Always use a hypothesis
1. Use an A/B Test Calculator.
The math involved in a statistically significant test result is intense. Don't even try on your own. Use an online test calculator to figure out if you have enough traffic and time for a proper test.
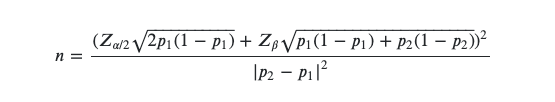
[ The “simple” equation behind an A/B testing tool]
I like this calculator from CXL and this popular one from Evan Miller.
If you've never played around with an A/B test calculator, you may be surprised that your startup doesn't have enough web traffic to run an A/B test. A good rule of thumb is if you don't have at least 1,000 conversions (signups, purchases, etc.) a month, you shouldn't A/B test [source]. You're better off with qualitative research and user testing in startups with low conversions.
Without a test calculator, you'll get terrible math. They might look great in a graph, but the results are not statistically significant. Meaning there’s a high probability they’re wrong.
2. Test bold changes, not minor tweaks
If you make big bets with your B version, your tests will likely show a perceivable change. That’s because the more variation between the two options, the faster you can achieve statistical significance. You can use your time better by testing big ideas as often as possible, especially with untested products.
Example: You want to measure which animal your customer finds to be heavier. If you set up a test where people choose between a raccoon or an opossum, the answers are more likely to be inconclusive.

These results are all over the place. It will likely take a lot of participants and a long time before patterns emerge. You can’t draw any conclusions or generalizations from this data. How can you improve here?
If you test to see if they choose a mouse or an elephant, it will probably yield more valuable results.

In this example, a pattern is emerging, but with only 10 participants, we’ll have to wait for a while. It’s likely that with more participants, you’ll have more consensus.
If you test a bolder idea against the control, you're more likely to get proof that one idea is preferable. Either way, ensure you’re testing with the proper size, and don’t jump to conclusions when you see an early pattern. Wait until the timeframe from your testing calculator is complete!
Tests are getting easier to set up with tools like Optimizely, but they still take time to design, code and set up. Ensure you're testing things that will provide big payoffs for your time. Optimizing the button color is probably not worth your time. There are more significant ideas with bigger gains to the business than different shades of your button color.
3. Always use a hypothesis.
A hypothesis is a prediction you make before running a test. Without a hypothesis, it's impossible to say you proved anything.
Testing calculators will help you determine the timeframe for your test, but you should document your hypothesis well before you start the clock on your trial. Agreeing on the prediction beforehand keeps you from changing your prediction as data starts to come in.
Hypotheses take many formats. In tech, the We believe… format is popular:
We believe that [feature]
for [persona]
will achieve [outcome].
We’ll know we’re right when [change in metric].
Example: We believe that this chatbot for onboarding users will improve retention of the first week. We’ll know we’re right when cancellations go down in the first week by 20%.
The We Believe… is a useful format since it encourages you to include the user and the metric, a step that you don’t want to skip! I don’t appreciate that this format invites confirmation bias with its “we believe” and “we’ll know we’re right” language.
If you want more rigorous experiments, don’t look for validation or confirmation that you’re right. Look at all the data, not just data that proves your hypothesis. Erika Hall says it nicely: “Aim to be proven wrong, and you’ll be far more right in the long run.”
A better alternative is the classic If, Then, Because format:
If [variable],
then [result]
because [rationale].
Example: If we launch a chatbot for onboarding users, then we can reduce cancellations by 20% because our research uncovered a correlation between cancellations and lack of onboarding.
I prefer this one for its simplicity, time-tested durability, and the included rationale. The rationale makes an excellent place to include past research insights or data points that are influencing the A/B test. If you use this format, you also want to have metrics that will help evaluate your hypothesis.
For better metrics, ask yourself:
Who will be impacted by the change?
How much will they be impacted?
What timeframe will you measure?
Testing without a hypothesis is like throwing spaghetti against the wall to see what sticks. A/B tests should help you make decisions, and a good hypothesis will put everyone on the same page before you start testing.
After the test, have a retro. A retro or learning meeting ensures you check the metrics and, more importantly, check back in on your prediction. Without this ritual, it’s tempting for everyone to form different meanings or forget about the results.
If you get stuck, seek advice from a data scientist/analyst/engineer, CRO person, growth designer, business intelligence person. Take them to lunch and pick their brain. They’ll be happy that you’re taking an interest in their profession!
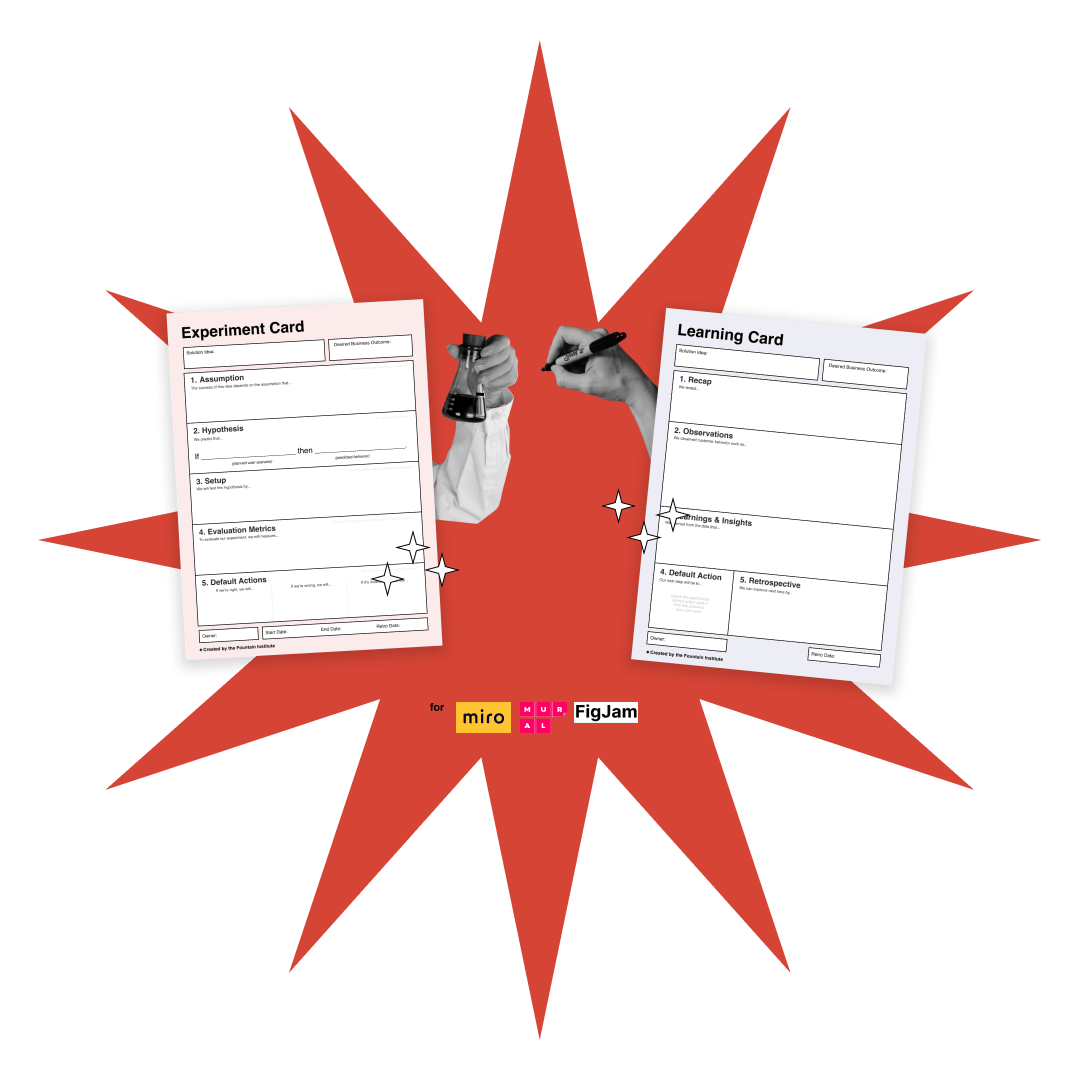
Turn Your A/B Tests into Product Experiments
Need help setting up an A/B Test? Use these cards for Miro, Mural, and Figjam and start testing like a scientist.
Learn More about A/B Tests
Read How do A/B tests work? by Cassie Kozyrkov from Google
Read A/B Testing Tutorial: From Beginner to Pro by Alex Birkett from CXL
Read Statistics for People in a Hurry by Cassie Kozyrkov
Read Why These Tech Companies Keep Running Thousands of Failed Experiments by Ben Clarke in Fast Company
Watch Is A/B Testing Faster than Usability Testing at Getting Results? by Jakob Nielsen