3 Types of UX Diagrams for Visualizing Qualitative Data

Qualitative UX data is difficult to communicate. It’s the reason that designers often struggle to make their case to business people.
That look of frustration when a customer clicks around your site...that moment their eyes light up when they talk about the pain your product solves...these moments are hard to share with stakeholders that weren't there.
The understanding that comes with studying customers could have a huge impact, but many designers don't always take the time to make UX learnings simple for stakeholders to digest. A visual would help, but visualizing qualitative data from UX research is hard.
Numbers aren’t easy to visualize, but there are already lots of tools. Google Data Studio and Flourish can create beautiful visualizations out of quantitative data in minutes. But what about qualitative data? Your research findings might be more of a concept than a set of hard numbers. How do you communicate a concept?!
Allow me to introduce you to my friend, the diagram. Diagrams allow you to share complex information quickly and effectively. You might also call them models, maps, or frameworks depending on how complex they get. There are 3 Types of Diagrams you can use to communicate qualitative UX data. Here’s a breakdown and some examples for each.
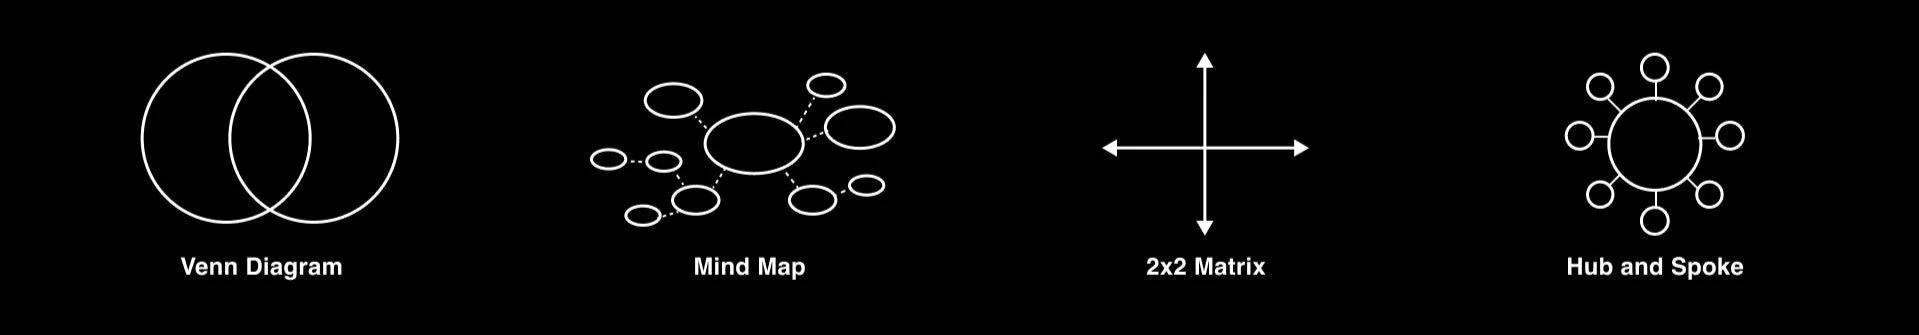
1. Comparison Diagrams
Are you comparing qualitative concepts?
These diagrams allow you to size up two or more concepts to see the differences. The Venn Diagram is the most common one here. Here are some other examples:
2. Hierarchy Diagrams
Are you communicating a series of steps or tasks?
These diagrams allow you to see the priorities of a whole. They're great at showing the parts in relation to the big picture. I like to use the Pyramid Diagram to indicate layers of meaning.

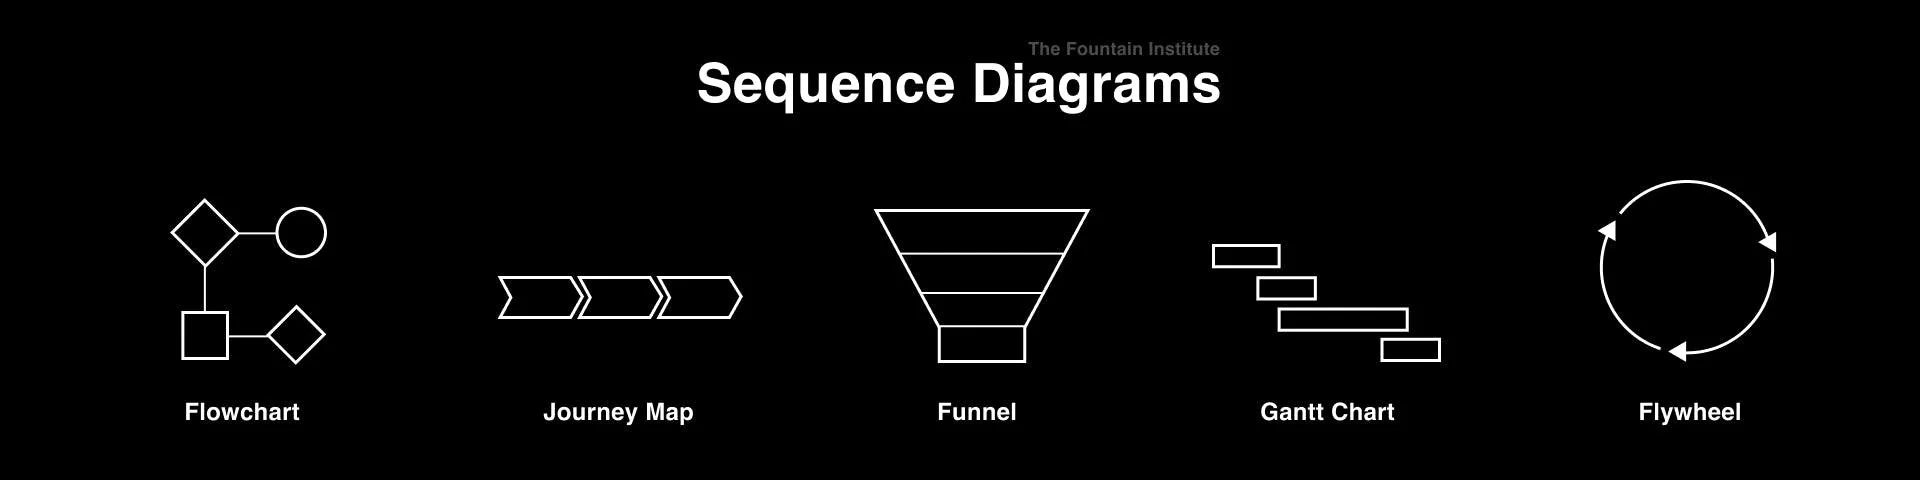
3. Sequence Diagrams
Are you trying to show priorities or structure?
If you've got a series of events or tasks, then your new best friend is a Sequence Diagram. Journey Maps and flowcharts are used extensively for mapping complexity in UX, but they're even more useful for communication in their simpler forms.
There you have it! These twelve diagrams are perfect for visualizing complex human behavior. Next time you're tempted to decorate a UX slide with a meaningless photo from Unsplash, try making a diagram instead.

Designing Slides?
Use the Audience Strategy Worksheet to design a human-centered presentation that is sure to engage.